Comparison M, M9P, Monochrom and M
For this comparison I used the Siemens testchart and the Image Engineering software, to eliminate any viewer-bias from the evaluation. As this test is meant for a comparison between camera sensors and maximum performance you have to eliminate as many variables as possible. The lens used is the Apo-Summicron-M 2/50 ASPH which has a resolution that widely exceeded the limiting frequency (Nyquist) of the cameras used here. The aperture selected is f/5.6 because then we have optimum MFT values. In addition stopped down to f/5.6 and used at a distance of 2 meters the depth of field will cover slight errors in focus and optical/mechanical/testing tolerances. The official DoF at this distance is 1.771 - 2.300 (a tolerance of 52.9 cm), but this is based on a circle of confusion of 0.03 mm. To use a smaller diameter of the CoC one has to look at the DoF at f/2.8 where we find a range from 1.878 to 2.139, a tolerance of 26.1 cm. At f/2 the DoF would be from 1.910 - 2.099, still 18.9 cm.
The IE software works best with images in JPG-format which brings an other problem: the camera post processing will enhance the sharpness of the image and we want to see the natural performance of the RAW images. The RAW/DNG images must be processed with image software on the computer to produce JPG images. But most if not all software will again enhance the sharpness in uncontrollable ways. The only program that produces natural images is DCRaw and the two programs that are based on this software (Graphic Converter and RAWDeveloper (with sharpness option set to off).
I will start with the conclusion and the impatient reader does not need to wade through graphs and numbers. The best result is delivered by the Monochrom, then the M and then almost equal the M9P and the M8.2.
It is standard procedure to set the lower limit of the resolution analysis to 10%. This value is the minimum difference in contrast that the normal user can detect at the edge of fine detail. Two other values are often used: 25% contrast and 50% contrast for medium and low resolution respectively. Fifty linepairs/mm at fifty% contrast is a kind of benchmark: higher values indicate extremely good optics and sensors and lower values represent below-state-of-the-art systems.
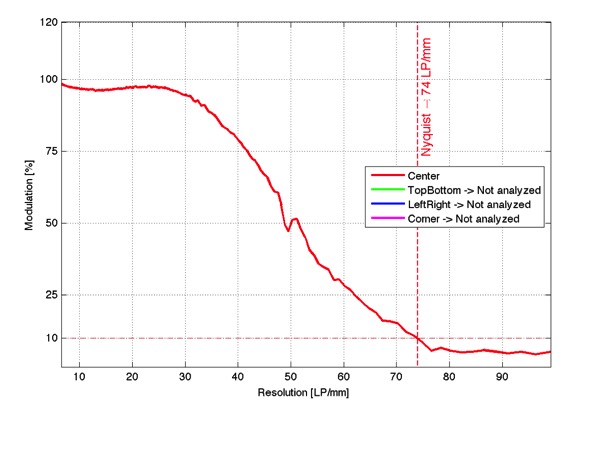
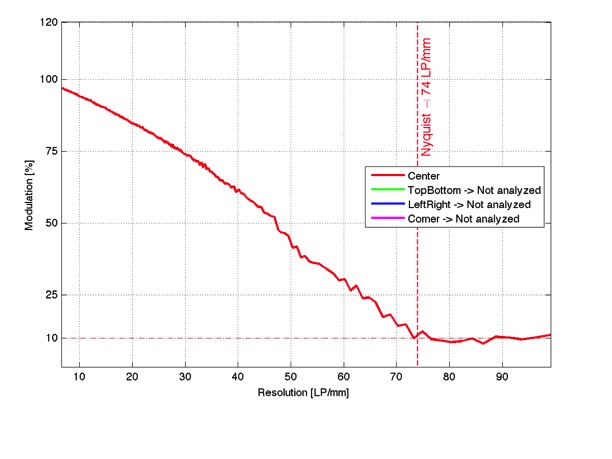
The Monochrom camera
The excellent values of the Monochrom are possible because of the lack of the Bayer filter.
The 10, 20, 50% values are 100, 94.78 and 57.56 Lp/mm.
The graph below shows that the classical 20 lp/mm and 40 lp/mm show outstandingly good values and even the 80 lp/mm show superior contrast of more than 25%.
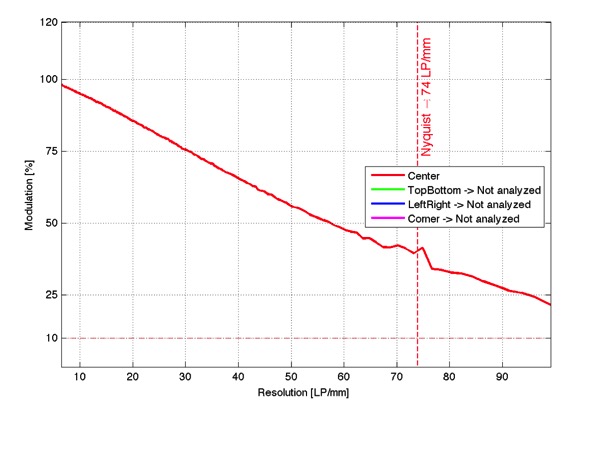
The M camera
The M camera has a slightly smaller pixel pitch of 60 micron (versus 68 micron in the CCD sensor), and this should be visible in a higher resolution at the limiting contrast values. The graph below shows that in particular the classical 20 lp/mm and the 40 lp/mm exhibit every high values, giving the pictures the outstandingly good sharpness impression. Even the 80 lp/mm are still very good.
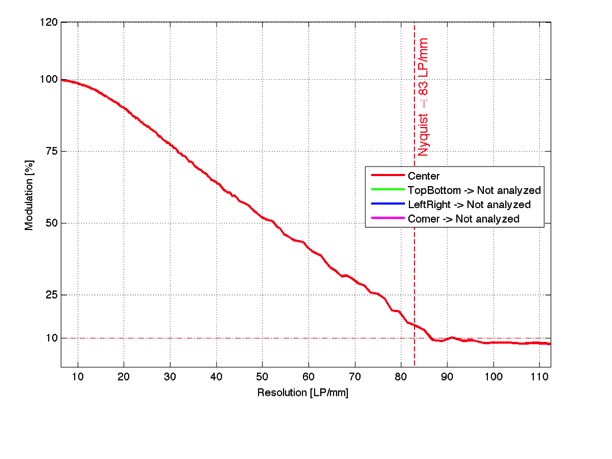
The M9P and M8.2 cameras
The M9 and M9P and M8/M8.2 share the same basic sensor and when used at identical distances the pixel pitch and image magnification are identical. It is no surprise that both cameras perform in the same league. For the M8.2 the 10, 20, 50% values are 73.24, 63.32 and 47.16 Lp/mm
Below the graph of the M9P
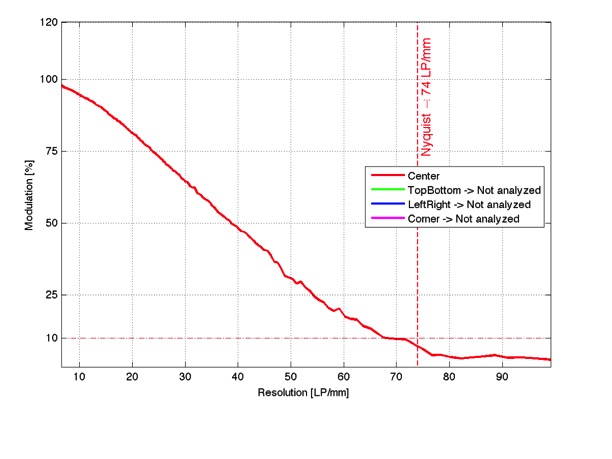
Below the graph of the M8.2
If you want to be very critical you might say that the M8.2 has the upper hand, but in practical photography these small differences in contrast and resolution are insignificant. One can create much ado about nothing to put these differences under a magnifying glass, but that does not help. One should note however that the M8 does not underperform compared to the M9 and this is as it should be. The widespread opinion that the M8 is inferior to the M9 is not correct. Only when the full sensor size and angle of view are added into the equation the performance of the M8 drops by about 20%, because the image magnification is lower.
The natural performance of the M9 is below that of the M camera. But when one uses the graph with a slight sharpening as is often done in the digital darkroom, then the M9 and the M converge in image quality as can be seen in two graphs below.
The effect of a slight sharpening (50% in LR5-beta) can be seen here. Now the M and M9P are very close in the performance for the low frequencies (where visual sharpness impression is highest) and the M has a clear edge (nu pun intended) at the high frequencies where edge sharpness will improve the visual impression of fine textural details. The M9P however has excellent results at the 40 line pairs/mm limit, the classical limit for high-definition and high-performance miniature precision cameras.