Photon distribution
09/07/15 19:54
To give some practical evidence for the theoretical study about the photon count I exposed the MM2 for 20 seconds with closed lens cap and in the dark. This should ensure that no light would enter the camera. In theory every pixel would have the value = 0. There is an automatically running noise reduction program by Leica (Request: give us the menu option to deselect this option). It is not known what the program does.
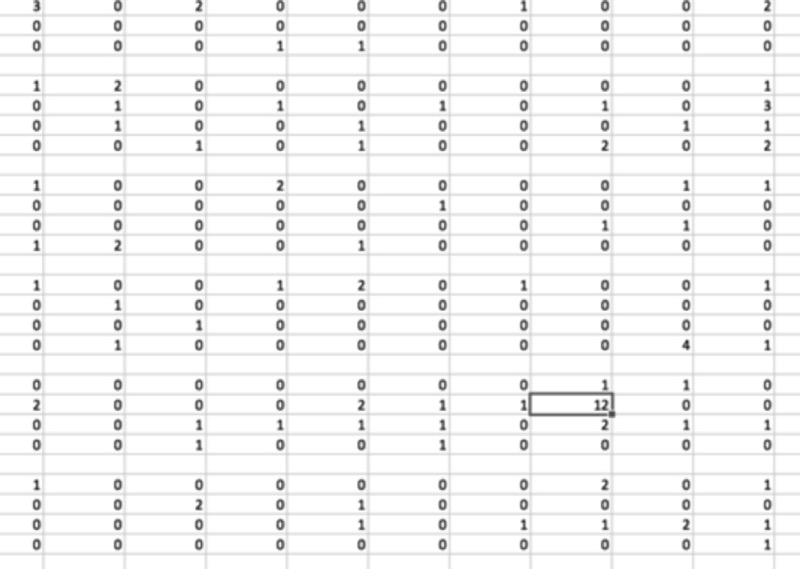
The analysis program gives an exact count of every pixel and it can be seen from this selection that the values range from 0 to 12 in this section of the sensor surface. Where there should be zero levels you will find 12 levels, roughly comparable with photons.

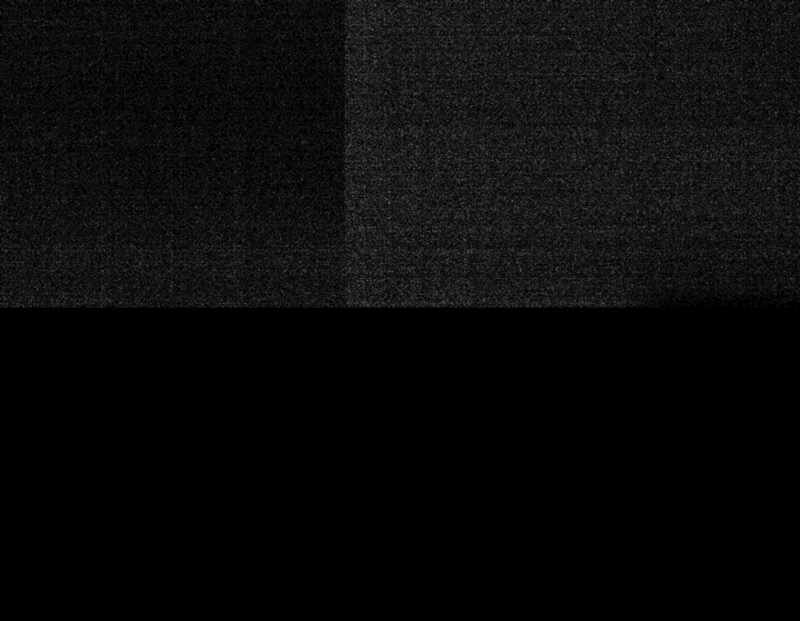
This conforms with the random or Poisson noise. Looking at the whole picture I detect four quadrants with equal area, but different noise pattern. See below the section where the four quadrants meet. It is intriguing to see that the top half of the sensor exhibits noise and the lower half almost none. So depending on the area where you look, the noise impression may be different.

A statistical count of all values gives this graph. Note that there is indeed a heavy concentration of the levels = 0 and = 1, but also quite a lot pixels with higher levels.

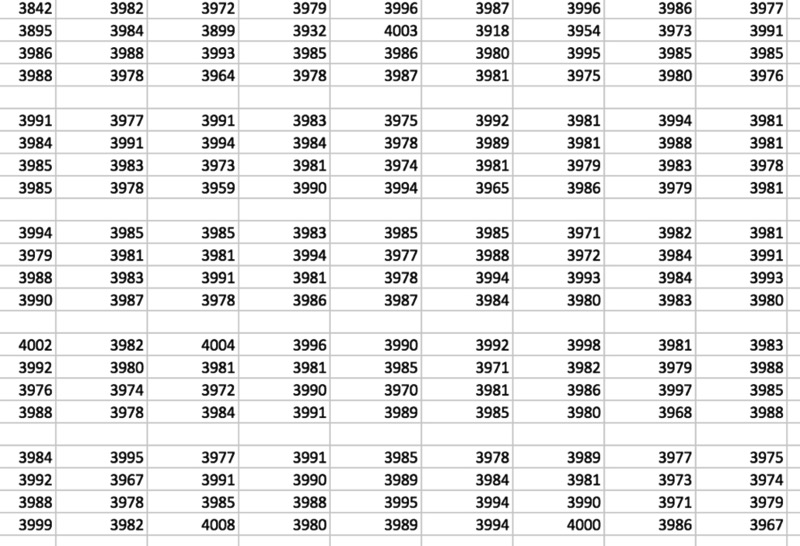
Below you find a section of a picture that was overexposed and should show identical pixel values. Note the variation and the fact that some cells exhibit values around 4000. Some persons showed a surprise that the nominal value for maximum white is 3750 and not 4096. The reason is explained in my book Leica Practicum: it is the standard safety level to account for heavy overexposure.


